Opportunity Cost: The cost of missing out on the next best alternative. The benefits that could have been gained by making a different decision.
- Distinguish between scientific decision-making and intuition/hunch based decision-making.
- Scientific is easier to justify
- Scientific will usually be more reliable
- Hunch based is much faster
- But may be less reliable
- It is cheaper to use hunch based
- Scientific is more common due to the rise of Big Data
- Not key stages in the decision-making process:
- Recording data
- Setting objectives
- Scientific decision-making is a lot more trustworthy and reliable. It can be backed up with evidence and data that supports or opposes a decision. Scientific decision-making also makes use of a wider set of information than a hunch. Hunches may be based on 1 or 2 things, whereas a scientific decision may be based upon hundreds or even thousands of data points.
- Intuition/hunch based decisions can be useful for when action is required quickly. If you don’t have the time or resources to make a scientific decision, then intuition is your best chance.
- In any decision, you will need to account for all possible risks and uncertainty that may come from a decision, and weigh it up against the possible rewards. If you do this correctly, you are unlikely to make any decisions where you lose more than you can afford.
- Opportunity cost is the benefits that have been given up by making a particular decision over another.
- Opportunity cost helps you to see what your resources are going towards, and what you’re getting back. It allows for a more analytical overview of decision-making.
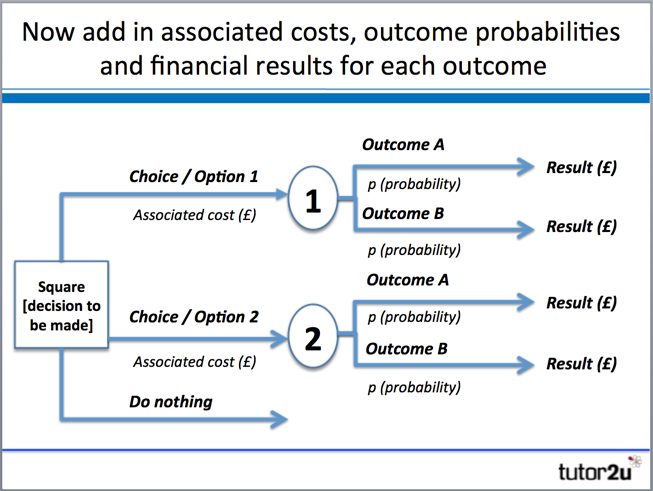
Decision Trees
- A mathematical model
- Used by managers to help make decisions
- Uses estimates and probabilities to calculate likely outcomes.
- Helps to decide whether the net gain from a decision is worthwhile.

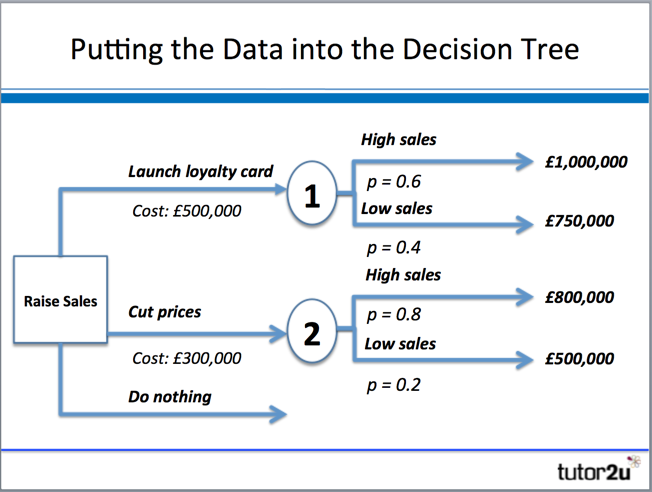
Expected Value: The financial value of an outcome calculated by multiplying the estimated financial effect by its probability.
Example:

High sales + low sales = Total Expected Value
Net gain = Total Expected Value - Cost
(A):
1.4m cost
⇒ 40% 2.5m payoff ⇒ 60% 800k payoff
0.4 * 2500000 = 1000000 0.6 * 800000 = 480000
1000000 + 480000 = 1480000 (1.48m) 1.48 - 1.4 = 0.08m net gain
(B): 0.5m cost
⇒ 30% 1m payoff ⇒ 70% 0.5m payoff
0.3 * 1000000 = 300000 0.7 * 500000 = 350000
300000 + 350000 = 650000 (0.65m) 0.65 - 0.5 = 0.15m net gain (C):
Do nothing. Not optimal.
Option B is the most profitable option.
== {Express in a single unit—everything in millions would have been good}
Advantages of using decision trees
- Choices are set out logically
- Options are considered in parallel
- Use of probabilities enables risk analysis
- Likely costs are considered as well as potential benefits
- Easy to understand & tangible results
Disadvantages of using decision trees
- Probabilities are just estimates—can be erroneous
- Uses quantitive data only—ignores qualitative aspects of decisions
- Assignment of probabilities and expected values prone to bias
- Decision-making technique doesn’t necessarily reduce risk
Quality of data inputted is equal to the quality of the data outputted.